
Session Resource History
Every VM-backed workspace records what it actually used — CPU, memory, disk I/O, and out-of-memory events — and keeps that history after the machine is gone. Open Resources in a chat session’s tool rail to read it. (Instant sessions are the exception — see below.)
This answers questions you previously had to guess at:
- The agent died mid-task. Did it run out of memory?
- This session took 40 minutes. Was it working, or waiting?
- Am I paying for a 16 GB machine to run something that peaks at 900 MB?
Where to find it
Section titled “Where to find it”In a project chat, open the session tool rail on the right edge and click Resources (the activity icon). The panel opens as a side drawer on desktop and full-screen on mobile.
The button is always there, including on sessions that already ended — which is usually when you want it, because the workspace is gone and this is the only record left. It is also there on sessions that never collected anything, where it explains why instead of hiding itself.
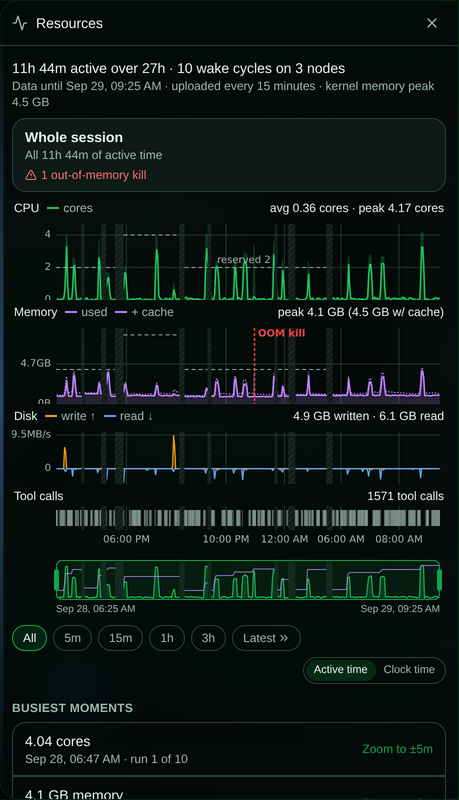
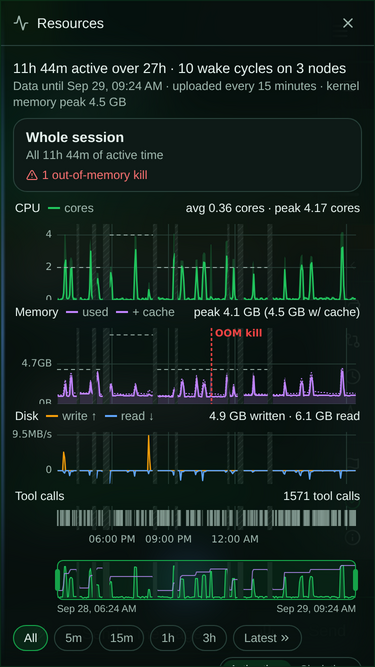
On mobile the same panel fills the screen and scrolls, with the summary and the out-of-memory warning first so the answer is above the fold.
Where resource history exists — and where it doesn’t
Section titled “Where resource history exists — and where it doesn’t”| Runtime | Resource history |
|---|---|
| VM-backed workspaces (standard sessions and tasks) | Yes |
| Instant sessions (Cloudflare Containers) | No |
| App deployment nodes | No |
The collector runs in the VM agent when it holds the workspace role, which Instant containers do not. Opening Resources on an Instant session says “Not recorded for Instant sessions” — that is the expected result, not a failure. A brand-new VM session says “No resource samples yet” instead: the VM agent uploads its samples every 15 minutes, so give a young session a few minutes.
Reading the panel
Section titled “Reading the panel”The drawer always opens on the whole session, from the first sample of the first wake to the newest upload. A session that slept and woke several times is one continuous timeline: each wake runs on a fresh workspace, and the gaps between them are drawn as hatched sleep bands.
The summary
Section titled “The summary”The line at the top says how much of the session was active, over how long, across how many wake cycles and nodes, how fresh the data is, and the kernel’s memory high-water mark. Below it, a card names what you are looking at — Whole session, or the time range you have zoomed to — and calls out any out-of-memory kills in that range.
This warning is the single most useful thing on the page. An out-of-memory kill is the usual explanation for an agent that stopped mid-sentence, produced a truncated result, or reported a tool crash it could not describe. The count covers both an allocation that hit the limit and a process the kernel actually killed, and the memory panel marks each one with a red OOM kill line.
SAM does not just watch this happen: when the node evicts a workspace under memory pressure it tries to preserve the session and bring it back through normal placement, so a single OOM does not necessarily mean lost work. What it does not do is change the size for you — see Right-sizing after you’ve read the history.
The panels
Section titled “The panels”Four panels share one time axis, so a moment in one lines up with the same moment in the others:
| Panel | What it shows |
|---|---|
| CPU | Cores in use. 1.0 means one core fully busy; 2.0 means two. |
| Memory | Used (the working set the kernel cannot reclaim) as a solid line, and + cache (used plus reclaimable page cache) as a dotted one. Older VM agents report only the total, including cache. |
| Disk | Write rate above the line and read rate below it. |
| Tool calls | When the agent had tool calls running, one mark per call. |
The headline beside each panel describes the range in view: average and peak cores, peak memory, bytes written and read, and the number of tool calls.
A dashed reserved line on the CPU and memory panels shows what that workspace reserved. Each wake has its own line, because a wake can land on a different size. Usage above the CPU line is normal (CPU is shared and only slows down); memory at the line is where out-of-memory kills happen.
Zoomed out, each point is an average over a minute or more, with the peak inside it shaded behind the line, so a short spike is never averaged away.
Zooming in
Section titled “Zooming in”Every view of the session is drawn from per-minute summaries SAM stores alongside the raw samples, so the whole session appears at once, however long it ran. When you zoom in far enough, the drawer fetches the underlying 5-second samples for just the stretch on screen, and only once: panning back over a stretch you have already seen does not download it again.
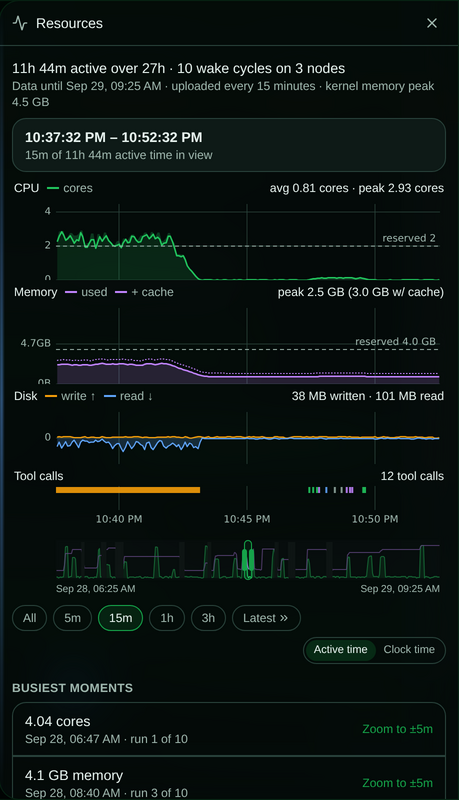
To move around:
| To… | On desktop | On a phone |
|---|---|---|
| Zoom to a time range | Drag across a panel, or pick 5m to 3h | Pinch, or pick 5m to 3h |
| Pan | Drag the window in the overview strip; swipe sideways | Drag the overview window; two-finger drag |
| See the whole session | All, or double-click a panel | All |
| Follow the newest data | Latest | Latest |
| Read one moment | Hover | Tap, or slide one finger sideways |
From the keyboard, focus the panels and use the arrow keys to step through time, + and - to
zoom, 0 to show everything, and Esc to clear the selected moment.
Reading one moment
Section titled “Reading one moment”Hovering, tapping or stepping to a moment replaces the card with the exact values there. The time says what kind of number you are reading: a plain clock time is a single 5-second measurement, and a time followed by something like · 1m avg is an average over that window, with its peak shown beside it.
Active time and clock time
Section titled “Active time and clock time”Active time (the default) squeezes the sleep bands down so the working stretches fill the width. Clock time draws the session to scale, so a nine-hour overnight sleep takes up nine hours of width. Use clock time when you need to line the chart up with something outside SAM.
Busiest moments
Section titled “Busiest moments”Below the controls, Busiest moments lists the highest CPU and memory peaks across the session. Each entry has a Zoom to ±5m button that jumps straight to it.
Very long sessions
Section titled “Very long sessions”The drawer loads up to 1,000 fifteen-minute segments — about ten days of continuous activity at
the default upload interval (WORKSPACE_RESOURCE_TIMELINE_MAX_CHUNKS). If a session has more, it
shows the newest ones and says exactly how many older segments are not shown; the card then reads
Everything shown rather than Whole session.
A gap means SAM has no observations for a stretch — the node was rebooted, the agent restarted, or the sampler fell behind. The line breaks rather than drawing across it. A gap is not a period of zero usage: do not read missing data as “the agent was idle.”
What this does not tell you
Section titled “What this does not tell you”The panel is easy to over-read. Four things it cannot tell you:
- Memory including cache is not “how much memory the program needed.” Page cache is reclaimable: a workspace that reads or writes large files — a clone, a build, a test run — climbs toward the machine’s limit as a matter of course, with no memory pressure at all. Read the used line where your VM agent reports it, and treat out-of-memory kills, not peak memory, as evidence that memory ran out.
- It is not per-process attribution. Samples come from the workspace’s cgroup — the whole container, including the agent harness, your dev server, test runners, and background jobs. A tool window that overlaps a CPU spike is a correlation, not proof that the tool caused the spike.
- It does not sample disk space. Only disk I/O (bytes read and written). If you are chasing a “no space left on device” failure, this panel will not show it.
- It does not explain what the agent was doing. SAM stores a hash of each tool-call ID and its start and end, never the arguments, output, file paths, commands, or prompts. Pair the timeline with the chat transcript to work out the “what”.
The drawer repeats these caveats under About this data, below the charts.
Was it working, or waiting?
Section titled “Was it working, or waiting?”A session that took an hour is not necessarily a session that did an hour of work. The timeline separates the two:
- Tool calls with CPU movement above them — the agent was running something.
- Tool calls with a flat CPU line above them — the agent was blocked on something external: a network call, a provider API, a slow download, a human. Elapsed time in a tool call is not work.
- No tool call at all — the agent was not executing a tool. Between turns this usually means it was waiting for you; mid-turn it usually means it was generating text.
Only the first case is improved by a bigger machine. The other two are improved by changing what the agent is waiting on.
Right-sizing after you’ve read the history
Section titled “Right-sizing after you’ve read the history”The point of the panel is to make a machine-size decision with evidence instead of instinct.
If you saw an OOM, raise the memory floor. Set it at whichever level in the requirements chain the problem belongs to — the project default for “everything here needs more”, the agent profile for “this agent is heavy”, the task itself for a one-off. Remember the host reserve: a 4 GiB machine can only back a ~3.5 GiB reservation, so asking for exactly 4 GB pushes you onto an 8 GiB machine.
Do not use “memory including cache looks close to the reserved line” as your trigger. Cache is reclaimable (see What this does not tell you), so a workspace that reads large files reaches it while having plenty of memory to spare. Out-of-memory kills are the signal.
If CPU stayed well under its reserved line and there was no OOM, you are likely paying for headroom you never used. Lower the requirement, or set the pool’s Workspace strategy to Smallest fit so SAM stops reaching for big machines.
If the timeline was mostly flat with long quiet stretches, the session was waiting rather than computing (see above) — a bigger machine will not help.
See Compute Pools for where each requirement is set and how SAM picks a machine from it.
How long it is kept
Section titled “How long it is kept”| Data | Default retention | Setting |
|---|---|---|
| Raw samples and per-minute summaries (what the drawer draws) | 90 days | WORKSPACE_RESOURCE_RAW_RETENTION_DAYS |
| Session summaries (peaks, totals, OOM count) | 180 days | WORKSPACE_RESOURCE_SUMMARY_RETENTION_DAYS |
Session summaries outlive the samples on purpose: the cheap “what did this peak at” answer stays available to agents (see below) for six months, while the per-sample detail expires first. Once the samples expire, the drawer says the detailed history has expired.
Deleting a project or a workspace deletes its resource history with it.
Self-hosters set both retentions, the timeline segment cap, the per-minute summary width, and the
detail-point cap as Worker variables —
the WORKSPACE_RESOURCE_* table under
Configuration → Durable Object Limits.
The collection-side settings (RESOURCE_HISTORY_SAMPLE_INTERVAL, RESOURCE_HISTORY_CHUNK_INTERVAL,
and the spool bounds) are read by the VM agent itself — see the
VM Agent configuration reference. SAM’s deploy pipeline
does not currently pass them through cloud-init, so changing them means editing the agent’s systemd
unit on the node; the defaults are what every managed node runs.
What is actually stored
Section titled “What is actually stored”The retained payload is deliberately narrow: timestamps, CPU-milliseconds, memory bytes, I/O bytes,
process counts, OOM flags, and hashed tool-call IDs with their start and end times. Its summary also
retains nullable agentProfileId, skillId, and agentType attribution. SAM resolves those fields
from server-owned records for the same project and workspace instead of trusting upload values.
It contains no prompts, messages, commands, tool names, tool arguments, tool output, file paths, environment variables, or secrets. That is what makes it safe to keep for months and safe to hand to an agent.
Asking an agent to read it
Section titled “Asking an agent to read it”Agents connected to SAM’s MCP server read the same data with the get_resource_history tool.
Called with no arguments it returns the agent’s own session — which is the useful case, because
an agent can check whether it is heading for the same wall that killed the last attempt. The returned
summary includes the server-resolved profile, skill, and agent type when available. Pass
sessionId, taskId, or workspaceId to look at a different scope — any one of them replaces the
agent’s own scope rather than narrowing it — and chunkId to pull one slice’s samples. Without chunkId it returns only the summary and chunk index, so a casual lookup
stays cheap. There is no projectId parameter — the project comes from the agent’s connection.
This turns a vague complaint into a checkable one. For example:
“Task
01M2…failed near the end. Useget_resource_historyfor that task, tell me whether it hit an OOM, and if so what its RAM peak was.”
The same information is available over HTTP at
GET /api/projects/:projectId/sessions/:sessionId/resource-history (also …/tasks/:taskId/… and
…/workspaces/:workspaceId/…), with an optional ?chunkId= for detail. The drawer itself reads
GET /api/projects/:projectId/sessions/:sessionId/resource-timeline (every segment of the session
with its per-minute summary) and …/resource-timeline/chunks/:chunkId (one segment’s 5-second
samples) — see the API reference.
Troubleshooting
Section titled “Troubleshooting”| What you see | What it means |
|---|---|
| ”Not recorded for Instant sessions” | Expected: Instant containers do not collect resource history yet. |
| ”No resource samples yet” | A VM session that has not finished its first 15-minute upload. Check back in a few minutes. |
| ”Detailed history has expired” | The session is older than the sample retention. Its peaks and OOM count are still available to agents through get_resource_history until the summary expires. |
| ”Resource history could not be loaded.” | The request failed. Use Try again; if it persists, report it from the same rail. |
| ”… older 15-minute segments are not shown” | The session is longer than the drawer’s segment cap (see Very long sessions). |
| A break in the lines in the middle of a busy session | A gap: missing data, not idle time. |
| A tool call with no CPU or memory movement above it | The agent was waiting on something external. A tool call’s length is elapsed time, not work done. |
| A wake with no reserved line | SAM has no reservation recorded for that workspace, usually one created before reservations existed. |